'Warm blob' in Pacific Ocean linked to weird weather
Posted by David Dagoli  on April 10, 2015, 3:35 pm on April 10, 2015, 3:35 pm
187.192.196.211------------------------Re: 'Warm blob' in Pacific Ocean - sea surface temperature links
Posted by Bret B on April 11, 2015, 10:08 am, in reply to "'Warm blob' in Pacific Ocean linked to weird weather"
187.148.213.46
Hey, great find, David! I hadn't heard about this yet. Could this explain some of the wet weather here this spring? Quite possibly. It's always tempting to just blame El Nino or La Nina, but El Nino was only declared recently and it's still not very strong. (Latest report: http://www.cpc.ncep.noaa.gov/products/analysis_monitoring/lanina/enso_evolution-status-fcsts-web.pdf) Whereas according to the article this "blob" has been around for over a year...
I found some good charts showing our area. Our sea surface temperatures are also above normal, but not as much as the US west coastal waters: maybe 1°C / 1.8°F for us: http://www.ospo.noaa.gov/data/sst/anomaly/2015/anoma.4.9.2015.gif
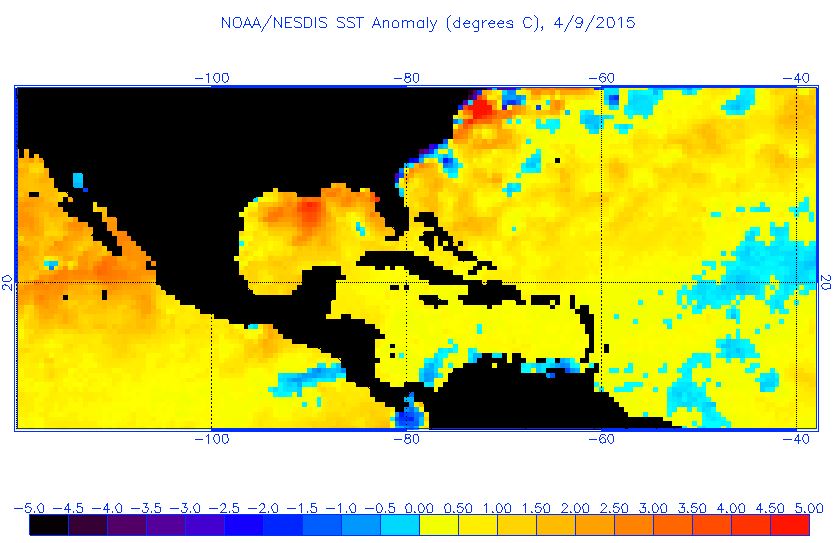
Here there are lots of static temperature charts, and links to other charts like SST "Anomaly" charts (showing the deviation from normal), and animated charts showing the changes over time: http://www.ospo.noaa.gov/Products/ocean/sst/contour/
Here's the best animated chart I found. It shows the western hemisphere over the last 6 months and features controls just like our good old GOES satellite IR loop. You can zoom in by first clicking the "Zoom" button below the color scale bar, then clicking in the chart where you want the zooming to be centered. Keep clicking to keep zooming (although the data gets pretty ragged if you zoom too far.) http://www.ospo.noaa.gov/Products/ocean/sst/anomaly/anim.html
Here's some regional animated charts, without any controls. Select "Western Hemisphere" for our best view, and you have 3 date ranges to choose from: http://www.ospo.noaa.gov/Products/ocean/sst/anomaly/anim_2mw.html
"More data, Igor!"  |
------------------------ |
|